Inflation is not cost of living
Part of my series debunking bad economics on the internet
TLDR: Housing, education and healthcare costs aren’t the dollar’s fault, even though they’re a huge problem
It’s a common refrain that we’re measuring inflation incorrectly. Most pieces, like this one, focus on the fact that we under-report Housing, Education and Healthcare prices. The claim is that measured inflation would be much higher if these were taken into account.
The basic problem is that these issues are all unrelated to the purchasing power of money. Remember the definition of inflation: a reduction in the purchasing power per unit of money. Since money is the unit of account for everything else, inflation is related to the change in price in money itself, not specific items in the economy.
The consumer price index (CPI) tracks inflation. It does this by tracking the prices of a list of things and carefully weighing the prices by how much they matter.
The Price of specific things changing is not inflation
Imagine the price of Rice goes down, keeping everything else equal. Obviously this is not a case deflation: it’s not the money’s fault that rice specifically got cheaper.
People make this mistake constantly. Inflation is not cost of living, and it’s especially not the cost of specific things.
If you’re concerned about how much your housing or healthcare cost against your wages, you want to track a “wage adjusted cost of living” index rather than a “price of money” index.
Education’s price problem
We touch on this topic in the automation FAQ: almost all wage growth in the last 40 years has been in college educated, urban workers. Here is a plot from David Autor’s Work of the Past, Work of the Future:
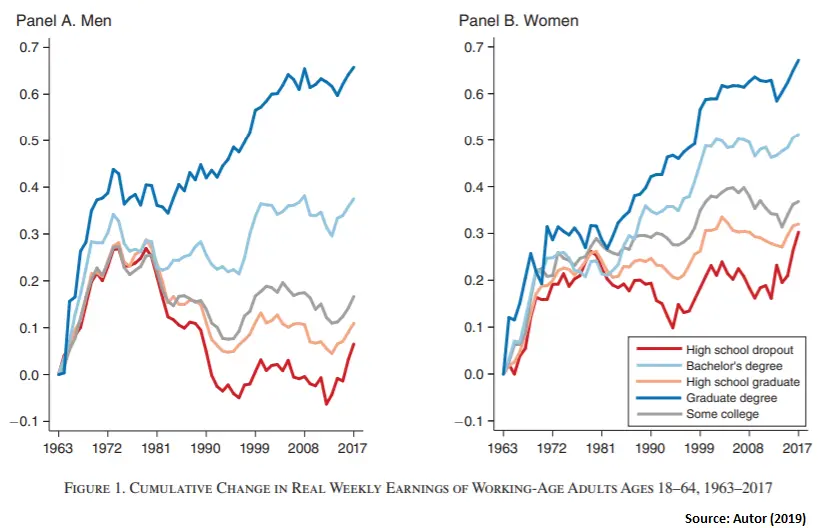
In this chart, the X axis is time, and the Y axis represents the overall percentage increase in wages since 1963. This data shows that real (inflation adjusted) wages have dropped since 1980 for all men except those with a college degree.
Education economics 101
Education provides both upskilling (AKA human capital) and a piece of paper that makes your resume not get put in the trash by people looking at it (a Market Signal).
Presumably, more competition among colleges could lower the economic value captured by colleges. But even if increased we competition among schools, going to a prestigious college lead to higher income. This is arguably due to the market signal - elite schools dont seem to form students any better, but even when adjusting for the kind of people who attend elite universities, a prestigious degree commands a higher income later in life (Dale & Krueger, 1999).
A core finding in the economics of signaling is that the cost of the signal is borne by the one emitting the signal. For education, this means that if employers find the market signal a college degree sends valuable (they do), the student has to pay for the equivalent in their tuition.
What’s happening with education is that universities are eating up the economic return to higher education. As put by Dale & Krueger (1999):
The internal real rate of return on college tuition for students who attended college in the late 1970s was quite high, […] But college tuition costs have risen considerably since the 1970s, driving the internal rate of return to a more normal level.
It’s not clear how much of the college education wage premium comes from signalling and how much comes from workers being actually more useful. Most studies on the topic find large signalling effects, but presumably people also, you know, learn things in school.
Whatever the case may be, universities are in a unique position to bottleneck the returns to education and drive the rate of return (degree costs - wage premium) towards 0.
Urban Housing
Before we get into why urban housing costs are insane, let’s note housing costs are, in fact, tracked in the CPI calculation. There is a great explanation here by Patrick Boyle.
The CPI tracks rent prices, and counts a house you own as you renting it to yourself. The Bureau of Labor Statistics (BLS) do this instead of tracking the asset price of the house. The asset price is unrelated to the cost of living. The cost of living is the cost of living in the house, not the cost of owning the financial asset.
That said, metro-area housing costs are rising much faster than other costs of living. As noted by Sam Bowman, this is causing massive, societal level problems like constraining economic growth and innovation, increasing inequality, and polarizing countries between urban and rural.
It’s important to put housing prices in context. First, note that housing price is not evenly distributed. And neither is housing price growth:
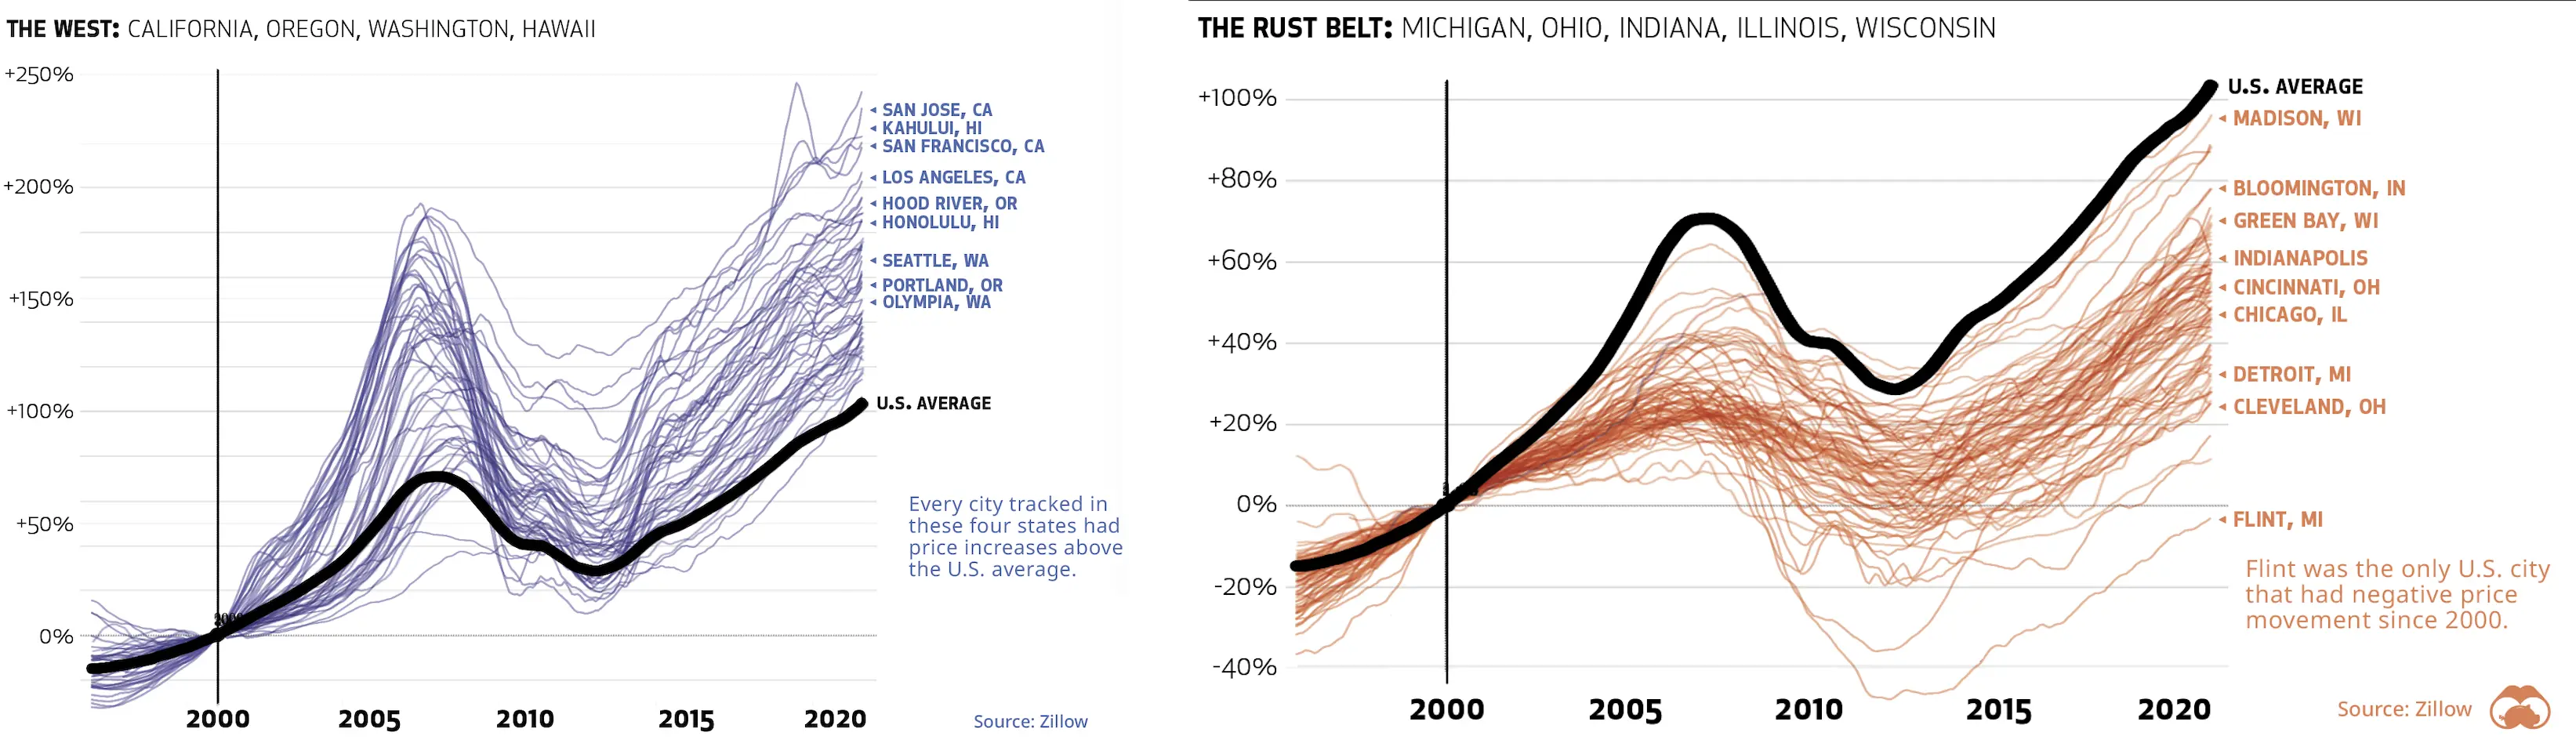
None of this housing price variation is related to the purchasing power of the dollar!
Urban housing in some specific cities is the problem. It is not much of a complex problem. For some reason, economic growth seems to happen in some cities where lots of people are close together. Knowledge sharing happens in these places - just living in such a city for a while makes you more productive for life.
Wage growth is for the urban dweller
Here is another plot from Autor’s “Work of the past, work of the future”:
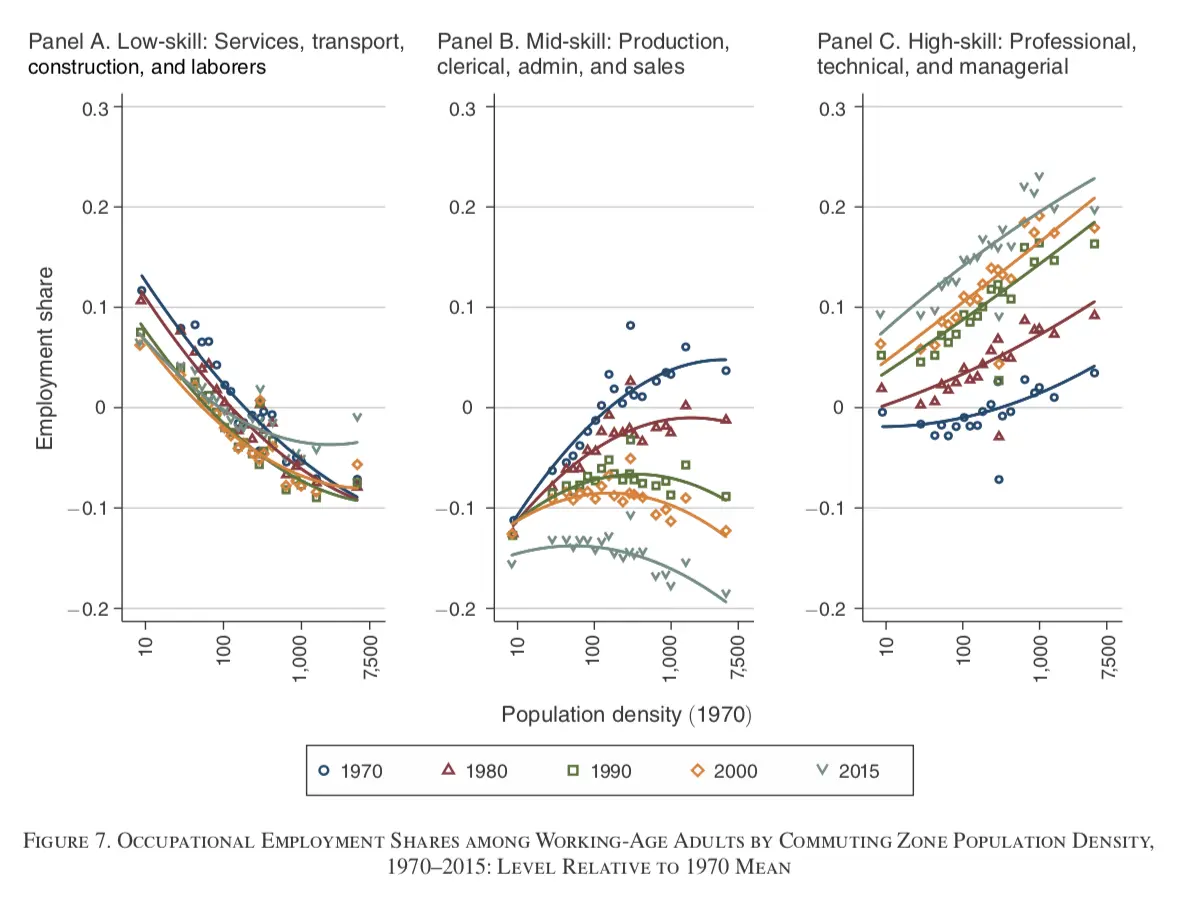
In this chart, the X axis on each plot is the population density of cities. The Y axis is the “employment share” - that is how much of the city’s economy is in this form of employment. Each colored line is a decade.
What we see is that as the decade go, the middle-skill jobs disappear (each decade is successively lower on the Y axis of the middle chart). Moreover, high skill work is gaining in share of total work, and is increasingly moving to cities (decades on the righthand plot move up, and grow steeper with relation to the population density). Lastly, we see that there is no increase in demand for low-skill work over the decades (the lines are bunched up in the left chart) - except for urban low skill work in the last 10 years (the grey 2015 data point sticking out).
What this data implies is that we’re separating into a two-tiered economy over the decades: college educated urbanites, and non-college educated rural dwellers. Employment share (and hence, wages) are only increasing for the college educated urbanites.
But land is limited in urban metro areas!
Unless you aggressively encourage building dense housing and you invest heavily in public transport (car-centric infrastructure is inefficient in land area used for urban settings), the growth in urban land demand will outstrip housing supply growth.
This places urban people who own urban land to extract economic value from all the innovation and productivity growth being created in by knowledge workers in cities in the last ~30 years.
Who’s gaining from economic growth?
Not the workers!
If economic surplus value is being produced, the question of “who gets the money” generally depends on bargaining power.
For instance, if you produce more and more value for an hour of labor, but you can only be employed by a single company (monopsony), then the company will likely take the profit and your wage increase will be low.
On the other hand, if a company absolutely needs your labor to exist, you should be able to extract high wages (assuming you negotiate as aggressively as you should).
Education and urban housing are bottlenecks capturing the economic growth from urban knowledge workers who seem to drive much of the economic growth in the western world.
The CPI is basically fine
Let’s go back to our example earlier where the price of rice decreases, all else equal.
The result of the price change is going to be a mix of two effects. First, the income effect, where you’re effectively richer because rice is cheaper, so you buy more of it. Second, the substitution effect, where you substitute buying bread for buying rice because rice is now comparatively cheaper.
Tracking inflation is not easy. If you’re tracking all prices across the economy for inflation, you can’t simply average the prices to get the inflation. Consumption behavior adjusts with price changes all the time. You need humans to make models and assumptions to weigh the prices correctly.
The billion prices project which used online data to re-estimate inflation, came to similar conclusions as the CPI index did.
Even the critics of inflation, who constantly state that it’s under-reported can’t come up with credible alternative measurements. For instance, we know that shadowstats take the CPI data and simply add ~2.8% to make it sound scarier and sell subscriptions to the people who want to feel like the world is collapsing.
Inflation mismeasurements would be obvious
Inflation is a growth rate. The measurement errors compound over time. If we systematically undercounted inflation - say, reporting 2% instead of 4.8% - it would be very obvious over time. Underreporting inflation by 2.8% over 20 years means prices would be mislabeled by 1.028^20 = 74%, something that would be obvious to anyone just walking into a store.